
Read every trip
An in-cab AI unit streams GPS, hard braking, sharp turns and time of operation from every cab, in real time.
除了机器之外,我们还在日常生活中为您提供支持。正在寻找 FLY 等产品?探索产品
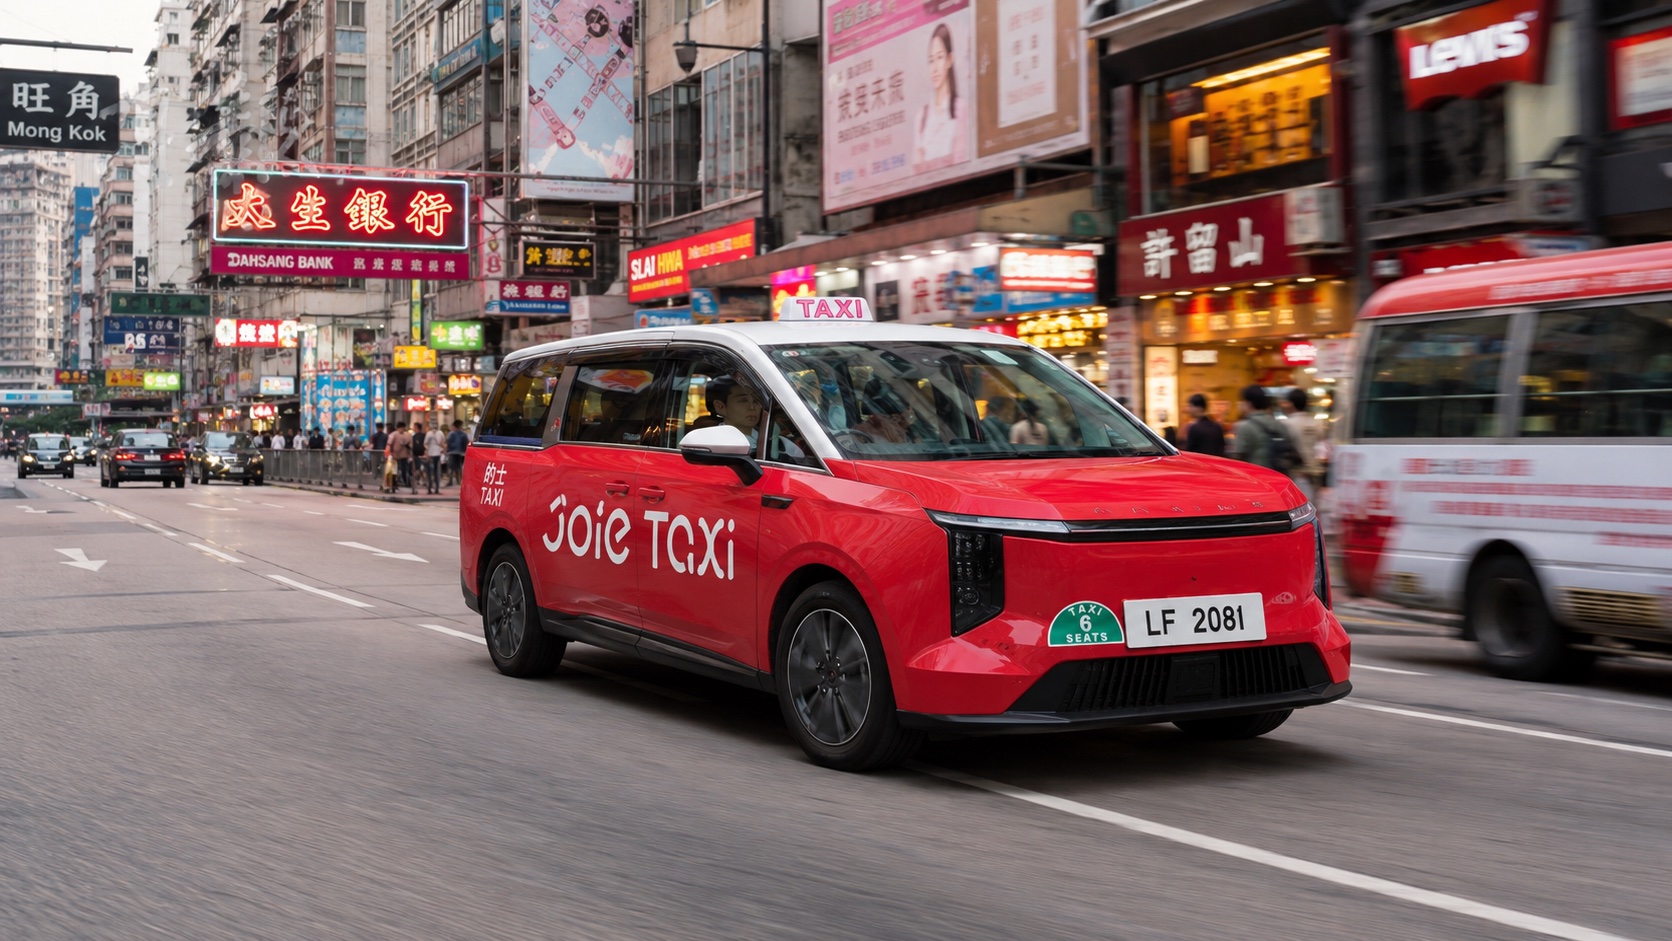
JOIE is putting 1,000 electric and hybrid cabs on Hong Kong's roads, run by Tai Wo Management. Each one carries an AI unit that streams its driving to YAS. YAS scores how every driver actually drives, and a licensed insurer prices each driver on that score — Hong Kong's first taxi insurance based on behaviour, not averages.




Underwritten by Zurich · scored by YAS (ARIA engine)
缺口
Taxi insurance is still set once a year, on variables that have nothing to do with how a fleet actually drives — and that single cadence costs operators on both sides of the ledger.
Priced once a year
Renewal premiums locked to vehicle age and demographics. Nothing a driver does moves the price until the next renewal.
Safe driving unrewarded
Everyone pays the fleet average, so careful drivers subsidise reckless ones.
Real cost stays invisible
Claims driven by behaviour the old policy never measured.
Live score per driver
Every trip updates a behaviour-based risk score, visible to operators and insurers.
Insurer-supported pricing
Licensed carriers use the score to support pricing; authority stays with the insurer.
Coach before claims
Risky behaviour flagged early, so fleets improve before losses land.
方案
Every cab streams its driving to YAS. The ARIA engine scores each driver, and a licensed insurer sets the price from that score. The platform now shown on our platform pages was built for JOIE first — and it has since scored 2.26 million trips on about 15.4 TB of driving data.
An in-cab AI unit streams GPS, hard braking, sharp turns and time of operation from every cab, in real time.
A new driver starts on the fleet average; after about 30 scored trips their own record takes over and the price becomes personal.
Poisson frequency × Gamma severity, validated against confirmed loss — the insurer prices off the score.
A live dashboard, driver rankings and safe-driving rewards turn the policy into a programme the operator can steer.
“Our mission isn't just to swap out petrol vehicles — it's to lead the industry toward smart urban mobility.”
Traction & risk trend
JOIE scaled fast: trips up 8.6×, distance up 10×, and the active fleet up 3× inside a year. As that many new drivers joined, the fleet-wide average eased back a few points — the arithmetic of a tripling fleet, not tenured drivers getting worse; new joiners enter below the line they soon climb past. What didn't move was the measurement: the same framework showed exactly which factors shifted and by how much, with speeding the consistent one to coach.
Fleet score is the average across all active drivers; the slide reflects a 3× larger, younger driver pool, not tenured drivers regressing.
Impact on driving
The same scores that price the policy power a live driver leaderboard — every driver sees exactly where they rank. Making safe driving visible and rewarding it gives each one a reason to climb, with a clear target to coach: speeding, the factor that moves the score most. The careful driver moves up; new joiners start below them and work up the same table.
What makes the score worth chasing is that it's their own. A new driver starts on the fleet average; credibility weighting then shifts the price onto their personal record by around 30 trips. Drive better and your number moves, fast.
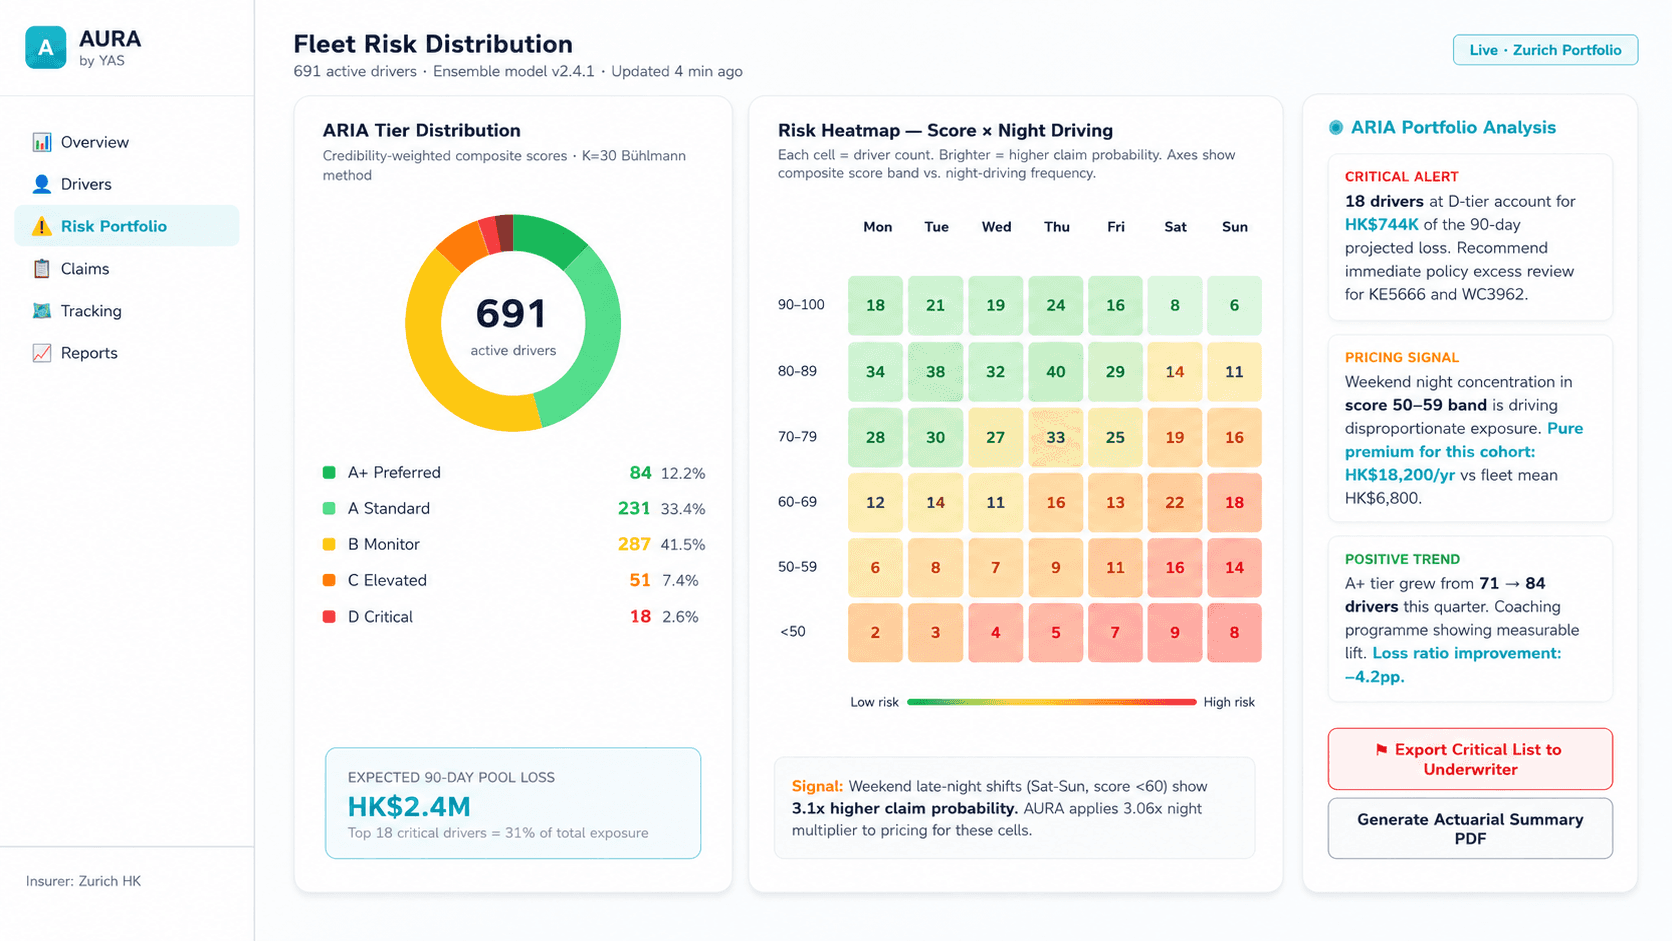
Carries 0.45× base claim frequency — the safest drivers, priced accordingly.
Preferred. Consistent behaviour earns a modest discount.
Watch band — elevated frequency; coaching flagged.
Carries 2.40× base frequency — priced for the risk and reviewed closely.
成果
JOIE isn't a one-year loss-ratio story. It's a method proven at scale: 2.26 million trips, about 15.4 TB of driving data, and the same model already reading fleets beyond JOIE. The engine that breaks a taxi fleet's risk down factor by factor is the one we now point at autonomous vehicles, robots and drones.